
The boys of summer are getting into full swing, and we are just over a month into the season. I have been checking out Out of the Park Baseball 27, and this year, they have added advanced sabermetric stats into the game. After playing the game for a bit, I thought it would be useful to create a simple guide that explains some of the stats. I will admit that I have learned a lot making this guide and probably will continue to learn. Is that not what life is all about? Please enjoy this simple guide that could help you understand some of the new statistics in this year’s edition of Out of the Park Baseball, now available on Steam or directly through their site.
All definitions are official definitions derived from using the Major League Baseball Glossary and Baseball Savant. All of these stat categories appear in the Advanced Stats tab of the player profile for their respective categories (hitter or pitcher).
BATTER AND PITCHER ADVANCED STATS (NEW)
1st Row
- BIP – Balls in Play
- GB/FB – Ground Balls to Fly Balls Ratio
- LD% – Line Drive Rate
- GB% – Ground Ball Rate
- FB% – Fly Ball Rate
- IFFB% – Infield Fly Ball Rate
- HR/FB – Home Runs per Fly Ball rate
- IFH% – Infield hit rate
- BUH% – Bunt hit rate
- Pull% – Rate the ball is pulled
- Cent% – Rate ball is hit up the middle
- Oppo% – Rate the ball is hit opposite field
- Soft% – Rate ball is hit softly
- Med% – Rate Ball is hit with average power
- Hard% – Rate ball is hit hard (Exit Velocity equal or greater than 95 MPH)
2nd Row
- AVG EV – Average Exit Velocity of hit balls
- MAX EV – Highest exit velocity of hit balls
- AVG LA – Average Launch Angle of hit balls
- Barrels – How many balls are barreled. A barreled ball a ball must have an exit velocity of at least 98 mph and a launch angle between 26-30 degrees.
- Barrel % – Percentage of hit balls in play that are barreled.
- Hard Hit – Number of balls in play that are hit over 95 miles per hour
- xBA – Expected Batting Average is the likelihood that a ball in play will fall in for a hit
- xSLG – Expected Slugging Percentage is the expected rate at which the batter will slug the ball based weighted by each type of hit the player has tallies. The formula is (1B + 2Bx2 + 3Bx3 + HRx4)/AB)
- wOBA (For some reason there is no tracking of this in OOTP 27 but including it for you stat nerds because it relates to the below stat) – Weighted On-Base Average is a look at what kind of hits (and walks) a player used to get on base rather than just if they did or not.
- Determined via historical scoring data to get an average contribution to run production. This changes every season as new numbers are added to the data.
- Home Run: Worth approximately 2.037 runs.
- Triple: Worth approximately 1.252 runs.
- Double: Worth approximately 1.252 runs.
- Single: Worth approximately 0.882 runs.
- Walk: Worth approximately 0.691 runs
Looking at those numbers, it can be stated that the average homerun is a 2-run homer.
xwOBA – Expected Weighted On-Base Average uses the same factors for each kind of hit.
Batter Only
HITTER STATS
BATTER STATS YOU MAY CONSIDER ADVANCED IN BATTING STATS TAB (OLD)
OPS+ – Adjusted On-Base Percentage + Slugging Percentage
WAR – Wins Above Replacement
To find these change the view of the Career Batting Stats or Batting Splits tabs of the Batting Stats of the player card.
- wOBA – Weighted On-Base Average
- ISO – Isolated Power
- BABIP – Batting Average of Balls in Play
- wRC+ – Adjusted Weighted Runs Created
- WPA – Win Probability Added
- UBR – Base Running Value
- BsR – Total Baserunning Runs Value
Percentile Rankings (Batters)
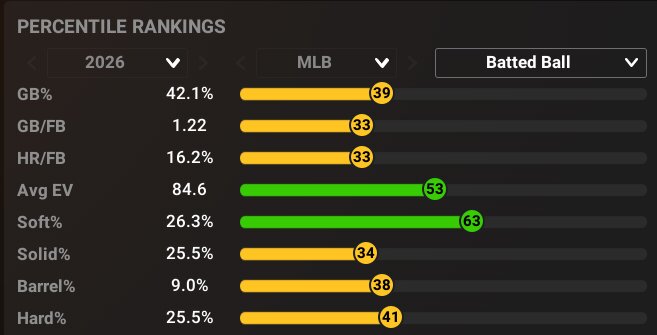
Batted Balls
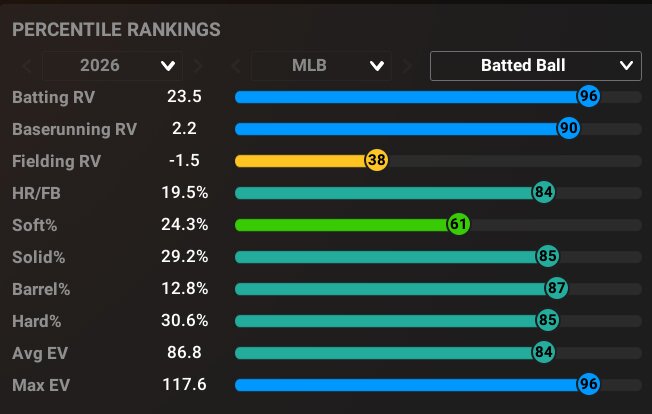
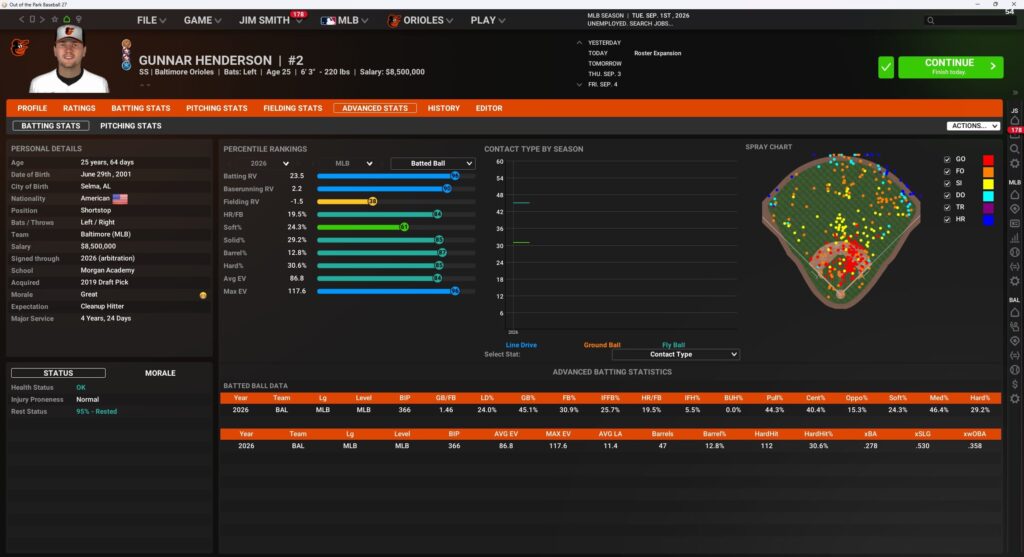
- Batting RV – Batting Run Value – This is the odds that a run will score during his at bat. In this case Gunnar has a 23.5% chance of having a run score during his at bats. It also shows the percentile for this stat. (Gunnar Henderson in this simulated season was in the top 4% of batting run value)
- Baserunning RV – Baserunning Run Value – This is the number of runs a player contributes when they are on base whether it is stealing bases or getting extra bases. In the case of Gunnar, when he was on base the Orioles were able to score 2.2 runs which puts him in the 90th percentile.
- Fielding RV – Fielding Run Value – This number is the amount of runs a player’s defensive performance (all aspects of it including holding runners from stealing in Gunnar’s case.) contributes to the team. In this case, Gunnar, who is typically not great defensively, causes his team to actually lose 1.5 runs per his defensive action putting him in the low 38th percentile of fielders.
- HR/FB – Home Runs per Fly Ball
- Soft % – Percentage of balls in play that are hit under 95 MPH.
- Solid % – Percentage of balls in play that are hit just under the definition of a barreled ball (See above for barreled ball definition)
- Barrel% – Percentage of balls in play that are barreled. (See above for barreled ball definition)
- Hard% – Percentage of balls in play that are hit over 95 MPH.
- Avg EV – Average Exit Velocity
- Max EV – Highest Exit Velocity achieved
Superstats
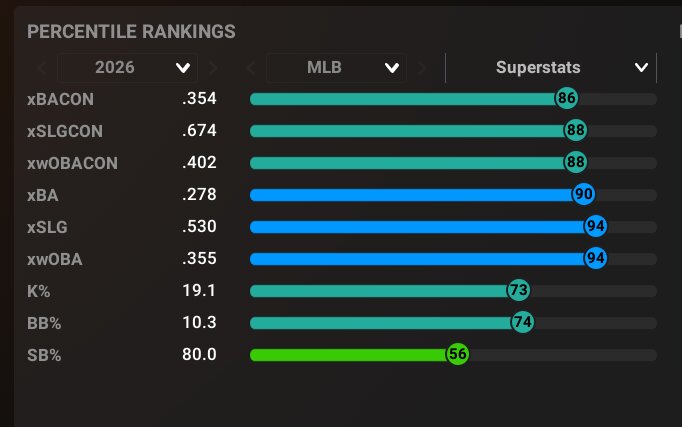
- xBACON – Expected batting average on contacted balls
- xSLGCON – Expected slugging percentage on contacted balls
- xwOBACON – Expected Weighted On Base Percentage on contacted balls
- xBA – See definition in Batter Advanced Stats (New) Section
- xSLG – See definition in Batter Advanced Stats (New) Section
- xwOBA – See definition in Batter Advanced Stats (New) Section
- K% – Percentage of strikeouts in at bats
- BB% Percentage of walks in at bats
- SB% – Percentage of stolen base success
Pitch Value
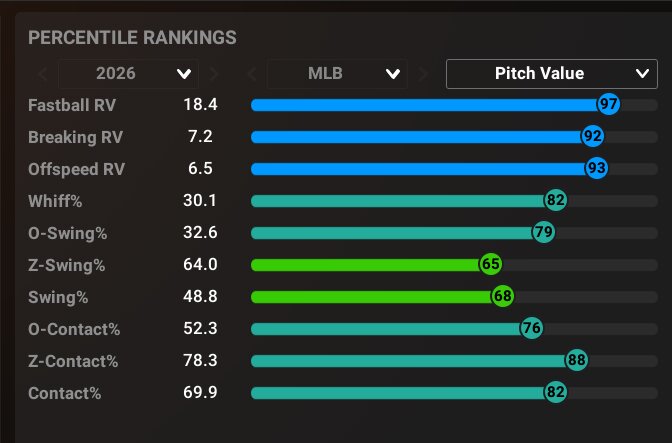
- Fastball RV – Run value on fastballs faced
- Breaking RV – Run value on breaking balls faced
- Offspeed RV – Run value on offspeed pitches faced
- Whiff% – Rate at which batter swung and missed at pitches
- O-Swing% – Rate at which batter swung at pitches outside the strike zone
- Z-Swing% – Rate at which batter swung at pitches in the strike zone
- Swing% – Rate at which batter swung at pitches thrown to him
- O-Contact% – Rate at which batter made contact with pitches outside the strike zone
- Z-Contact% – Rate at which batter made contact with pitches in the strike zone
- Contact% – Rate at which batter made contact with pitches thrown to him
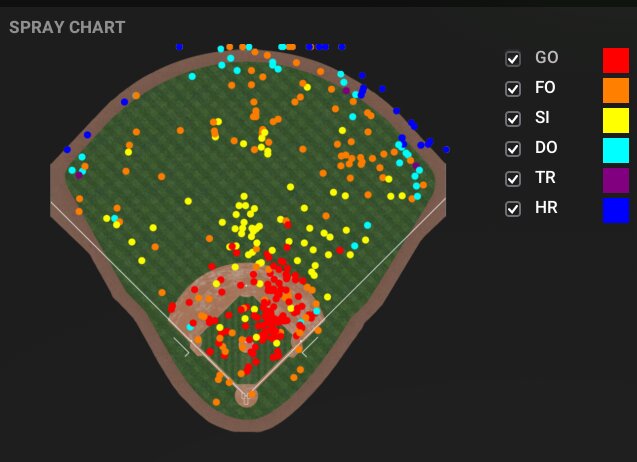
Batter Spray Chart
- This shows where a batter has hit the ball. As you can see you can change what is shown. The legend contains:
- GO (Groundout)
- FO (Flyout)
- SI (Single)
- DO (Double)
- TR (Triple)
- HR (Home Run)
Pitcher Only
PITCHER STATS YOU MAY CONSIDER ADVANCED IN PITCHER STATS TAB (OLD)
- BABIP – Batting Average of batters faced when they put the ball in play
- ERA+ – Adjusted Earned Run Average – Earned Run Average that also takes into account ballpark factors. A full table of Ballpark Factors can be found here at Baseball Savant
- WAR – (See definition above)
3rd Row in Advanced Stats

- Pitches – Number of pitches thrown
- O-Swing % – Percentage of pitches thrown outside the zone were swung at
- Z-Swing % – Percentage of pitches thrown inside the zone were swung at
- Swing% – Percentage of pitches thrown were swung at
- OC% – Percentage of pitchers thrown outside the zone
- ZC% – Percentage of pitches thrown inside the zone
- Zone% – The ratio in percentage of balls thrown in the zone to balls thrown out of the zone
- RV – Run Value
- RV-FB – Run Value on Fastballs thrown
- RV-BR – Run Value on Breaking Balls thrown
- RV-OFF – Run Value on Off Speed Pitches thrown
- Close% – Percentage of pitches thrown in a 2-strike count
- Whiff% – Percentage of pitches thrown that resulted in a swing and miss
- Chase% – Percentage of pitches thrown outside the zone that batters chased at
Percentile Rankings (Pitchers)
Batted Ball
- GB% – Percentage of pitches hit that ended up as ground balls
- GB/FB – Ground ball to Fly ball ratio on pitches hit
- HR/FB – Homerun to Fly Ball ratio on pitches hit
- Avg EV – Average exit velocity for balls hit
- Soft % – Percentage of pitches thrown that were hit into play softly
- Solid % – Percentage of pitches thrown that had solid contact made on them
- Barrel % – Percentage of pitches thrown that were barreled
- Hard % – Percentage of pitches thrown that were hit hard
Superstats
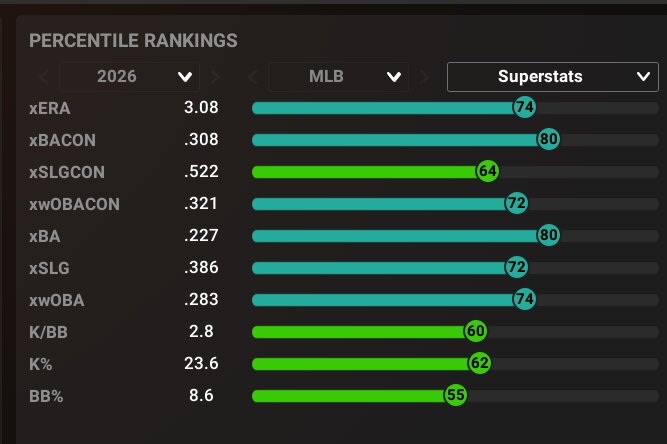
- xERA
- xBACON – Expected batting average on contacted balls
- xSLGCON – Expected slugging percentage on contacted balls
- xwOBACON – Expected Weighted On Base Percentage on contacted balls
- xBA – See definition in Batter Advanced Stats (New) Section
- xSLG – See definition in Batter Advanced Stats (New) Section
- xwOBA – See definition in Batter Advanced Stats (New) Section
- K/BB
- K% – Percentage of strikeouts in at bats
- BB% Percentage of walks in at bats
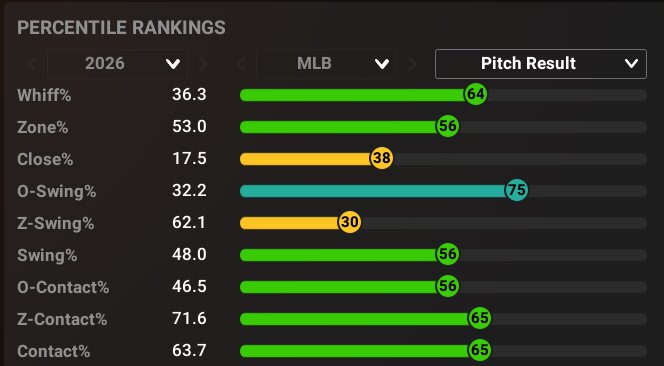
Pitch Result
See other definitions in Pitcher 3rd Row of Advanced Stats except for Contact %, which can be found in the Batter’s Pitch Value Section.
Pitch Type
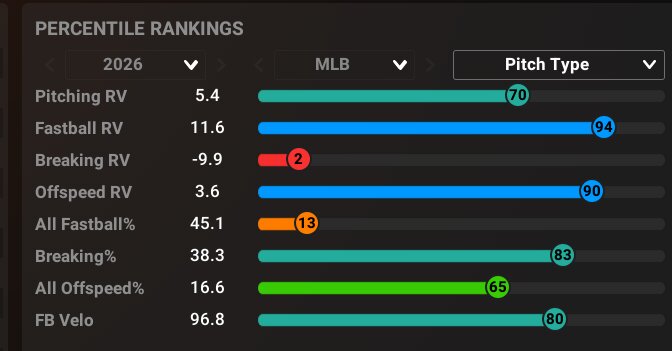
- Pitching RV – Pitching Run Value – Avg number of runs a pitcher prevented based on his pitching
- Fastball RV – Fastball Run Value – Avg number of runs a pitcher prevents when throwing a fastball
- Breaking RV – Breaking Run Value – Avg number of runs a pitcher prevents when throwing a breaking ball
- Offspeed RV – Offspeed Run Value – Avg number of runs a pitcher prevents when throwing an offspeed pitch
- All Fastball% – Percentage of any type of fastball thrown
- Breaking% – Percentage breaking balls are thrown
- All Offspeed% – Percentage of any type of offspeed pitch thrown
- FB Velo – Average Fastball Velocity
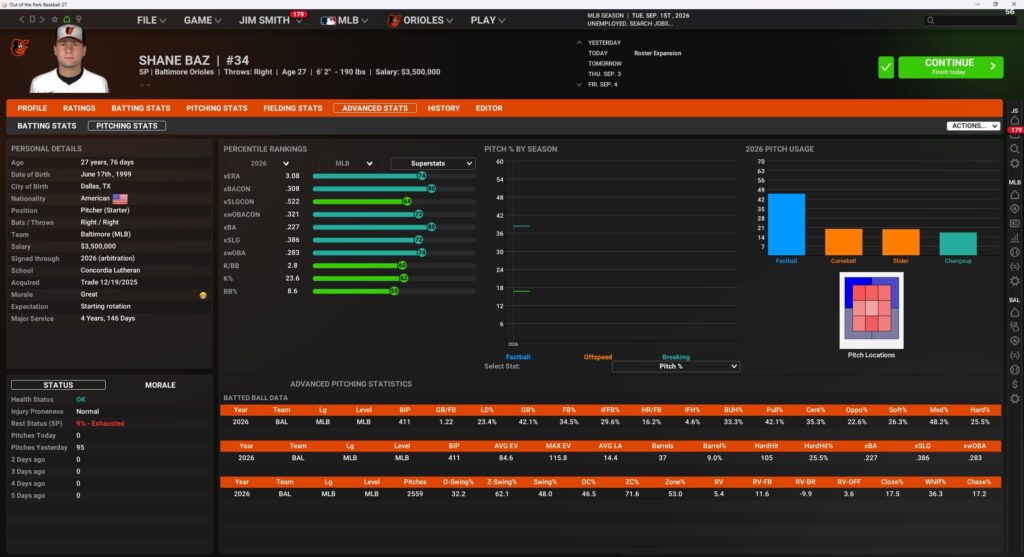
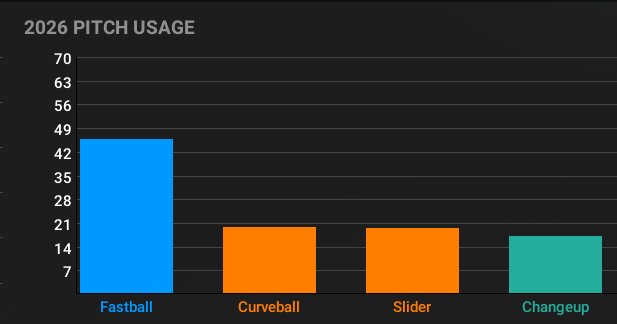
Pitch Usage Chart
This shows the percentage of pitches the pitcher used.
If anything is missing from this guide that you feel should be added, please contact me on X at @darthpyrin.